


Globular Clusters and Red Giants refute 'Young' Universe
The physics of stars date globular clusters and red giants and demonstrate the universe is at least 11 billion years old
Alec MacAndrew
Introduction
Young Earth Creationists commonly claim that the Universe is between 6000 and 10,000 years old. There are many lines of evidence that show that they are wrong by six orders of magnitude. The claims of Young Earth Creationists differ from the conclusions based on the scientific evidence by such a large factor (they are different by a factor of a million or more), that a literal interpretation of Genesis can be sustained only by massive distortions of the data, or by invoking miraculous intervention, such as the concept of creation with light in transit.
Creation with light in transit is one species of the generic idea that God could have created the Universe as long ago or as recently as He chooses and make it appear to be any other age that he chooses. Believers are free, of course, to believe whatever they like and to invoke supernatural intervention to explain away incovenient evidence. However, science eschews such intervention and works by assuming that the universe is a well-behaved place where things are as they seem. As far as scientists are concerned, if the evidence supports the idea that the universe is 13.7 billion years old then that is what it is.
And the evidence is overwhelming. In this article, I am going to present one line of evidence that demonstrates a lower limit to the age of the universe of 11 billion years. By dating the stars in globular clusters and the least massive Red Giants elsewhere in the universe, we can set a lower limit to the age of the universe.
Main Sequence Stars
First of all, let us look at the physics of stars and how stars develop over time. Stars are enormous balls of very hot gas. The gas condenses out of the interstellar medium by the action of gravity. The main constituents of stars are hydrogen and helium roughly in the ratio of 74:26 by mass. This is the same ratio we see in primordial gas clouds - ie in clouds where the gas is composed of hydrogen and helium formed at the nucleosynthesis stage of the Big Bang. As a star condenses out of the primordial gas cloud it becomes smaller, denser and hotter. As it continues to collapse, the temperature and pressure in the core of a star steadily increases, until it becomes great enough to ignite the fusion of hydrogen in the core. Eventually the conditions in the star come into equilibrium, the gravitational forces become exactly balanced by the pressure, the collapse stops and the star settles down to a stable condition.
The first order physics of stars is well understood. A star in the main stage of its evolution (a star in this state is called a 'main-sequence' star) is in equilibrium between the force of gravity which is attempting to cause the inward collapse of the gas that makes up the star and the outward pressure exerted by the very hot gas at its centre. In addition, a star in the main sequence is in energy equilibrium - the energy radiated by the surface of the star is balanced by the energy released in the core of the star by nuclear fusion of hydrogen. These two states of equilibrium can last for many billions of years.
There is a very strong relationship between the mass of the star, its temperature, its luminosity and its longevity. The luminosity of a star is the total amount of energy being radiated per second from the star and is commonly measured relative to our sun (Lsun). The luminosity of the star is related to its surface temperature and radius. Stars obey the Stefan-Boltzmann law (the black-body law) that relates the energy given off per unit area per second to the surface temperature of the star. The luminosity or energy radiated per second is proportional to the square of the radius and the fourth power of the surface temperature of the star.
We can measure the luminosity of stars (by measuring how bright they appear to us and how far away they are) and their temperature (by measuring their colour - the hotter they are, the bluer they appear). We can measure these two variables and plot them on a scatter diagram called a Hertzprung-Russell (H-R) diagram. You can see by looking at the example below, in Fig 1, that many of the stars lie on a sloping band from bottom right to top left of the diagram. These are the stars that are called 'main sequence' stars.
|
Figure 1: the luminosity-temperature relationship of stars - also known as the H-R diagram |
|||||
We can see for main sequence stars that there is a strong relationship between the surface temperature and the luminosity - the higher the surface temperature of the star the more luminous it is. (There are other sorts of stars that fall elsewhere in the diagram, but they are stars in a later stage of their evolution that are not relying on hydrogen fusion in their cores for their only source of energy, and therefore their physics is somewhat different. Let's stick with main sequence stars for the moment.) .
Why do main sequence stars fall on a band? Luminosity is related to temperature but also related to radius. So why don't the stars fall all over the H-R diagram? For example, a hot but very small star would fall in the bottom left of the H-R diagram as its luminosity would be low, since although it would have a high radiation power per unit area, it's surface area would be small. Conversely a cooler but bigger star would fall in the top right, as although its radiation power per unit area would be low, its surface area would be very large.
We said earlier that main sequence stars are stars in the first age of their evolution that are composed of hydrogen and helium roughly in the mass ratio of 74:26 at the start of their lives. They rely on the fusion of hydrogen into helium for their energy. The tendency of the huge mass of gas to collapse under gravity is offset by the gas pressure at the centre of the star - the so called hydrostatic equilibrium. Now, the conditions near the centre of the star (where the thermonuclear reaction take place) depends mainly on the mass of the star. The greater the mass of the star, the higher the pressure at the centre, and the greater the temperature. The pressure at the centre of our sun is an unimaginable 250 billion times the atmospheric pressure at sea level on earth (250 billion bar or 3.6 trillion pounds per square inch or 250 billion kilograms per square centimetre). The temperature is 16 million Kelvin At these temperatures and pressures thermonuclear fusion takes place - hydrogen fuses through the proton-proton reaction and forms helium. The energy released in the core of the star by the thermonuclear reaction is transported by convection and conduction to the surface of the star where it radiates away.
The rate of the thermonuclear reaction is very sensitive to the core temperature and pressure. The rate of the proton-proton reaction which occurs predominantly in less massive stars goes as the 4.5 power (rate proportional to T4.5) of the core temperature. (The CNO cycle that occurs in higher mass stars is even more sensitive to temperature than that.) So, for the p-p reaction, if the temperature in the core doubles, the fusion reaction rate increases by a factor of about 23! So both the temperature and the luminosity (which remember is the total radiation per second from the surface of the star) depend in a relatively simple way on the mass of the star. The higher the mass of the star, the higher its core pressure and temperature, the faster the thermonuclear reaction and the higher its surface temperature and luminosity. Main sequence stars fall on a band on the H-R diagram and not scattered all over the diagram because they all follow this relatively simple relationship; the surface temperature and luminosity of a main sequence star depend mainly on its mass.
Now we have said that the energy in main sequence stars comes for the thermonuclear fusion of hydrogen into helium. But there is only so much hydrogen available in the core of a star and sooner or later, the fuel runs out. When that happens the core of the star cools and contracts, and the outer layers expand, the star becomes a red giant and no longer lies on the main sequence line of the H-R diagram but to the right of the main sequence (in other words the luminosity of the star stays about the same - actually it increases a little - but its surface temperature drops.) How long does that take? At first sight, you might that think that the bigger a star is then the more hydrogen fuel is available and the longer it will last. But we've seen above that more massive stars burn their fuel much more quickly than less massive stars. So it turns out that more massive stars have a much shorter life than less massive stars. Small stars are cooler, less luminous and much longer lived. Big stars are hot, very luminous and short lived (they live their lives in the words of Jack Kerouac 'like fabulous Roman candles'.).
Because the reaction rate is so sensitive to temperature in the core, the luminosity of a star goes between the third and fourth power of mass:
The lifetime is simply proportional to the mass of fuel available divided by the rate of using that fuel:

So the lifetime as a function of mass is given by:
We can calculate how fast, for example, our sun is using up its fuel. We can measure its luminosity. The total energy being emitted by the sun is 385 x 1024J/s or 0.385 billion billion billion watts. That energy is generated by a fusion reaction whereby the difference in mass between four hydrogen nuclei that we start with and one helium nucleus that we end with is 0.7% of the starting mass. Since this is a mass to energy conversion reaction we can use the famous Einstein equation E = mc2 where c = 3 x 10⁸ m/s to calculate the mass lost to energy. This works out an astonishing 4.3 billion kilograms per second (in other words, the sun is losing mass that is being converted to energy at the rate of about 4.3 million tons per second). We know that in the fusion of hydrogen 0.7% of the mass is converted to energy. So the total mass of hydrogen fusing to helium in the core of the sun is 614 billion kg/s (or about 600 million tons per second). This seems like an awful lot, but the mass of hydrogen in the sun is about 1.4x1030 kg (1,400 billion billion billion tons) and the sun weighs about 2x1030kg altogether. We know that about 10% of this is available to be converted before the sun becomes a red giant and comes off the main sequence (10%, because the burning is taking place only in the core which represents about 10% of the total mass of the star). A simple calculation shows that it takes 10 billion years for 1.4x1029 kg of hydrogen to be converted to helium at the rate of 6 x 10⁹ kg/s. So the lifetime of a star the size of our sun is 10 billion years. From various radiodating measurements we know that the solar system is about 4.5 billion years old which would mean the sun is about halfway through its life.
The table below shows the luminosity, surface temperature and lifetime of new main sequence stars of different mass.
|
Spectral Type |
Mass (in solar masses) |
Luminosity (relative to sun) |
Surface Temperature (°K) |
Lifetime (years) |
|
O4 |
90 |
990,000 |
48,000 |
2 million |
|
O8 |
23 |
170,000 |
36,000 |
8 million |
|
B2 |
14.2 |
5,700 |
25,400 |
20 million |
|
B6 |
5.2 |
500 |
14,000 |
75 million |
|
A2 |
2.54 |
26 |
8,970 |
670 million |
|
A8 |
1.76 |
8.6 |
7,580 |
1.28 billion |
|
F5 |
1.4 |
3.2 |
6,440 |
3.44 billion |
|
G2 |
0.99 |
1.1 |
5,860 |
10.1 billion |
|
K0 |
0.79 |
0.42 |
5,250 |
21 billion |
|
M0 |
0.51 |
0.077 |
3,850 |
75 billion |
|
M6 |
0.21 |
0.0053 |
3,050 |
1 trillion years |
|
M9 |
0.1 |
0.0003 |
2,510 |
10 trillion years |
Red Giants
What is a red giant and how does it form? As we have seen above, a main sequence star fuses hydrogen in its core to power it. As this process proceeds it produces helium 'ash' in the core of the star. Because helium is denser than hydrogen, it tends to accumulate in the centre of the core, reducing the concentration of hydrogen. Since older stars on the main sequence have more helium in their cores than younger stars, the conditions for fusion and heat transport are a little different. This is why main sequence stars lie on a band on the H-R diagram rather than on a narrow line.
However, eventually, a more dramatic change takes place. The hydrogen in the core of the star becomes so depleted and the helium becomes so concentrated, that the fusion reaction in the core stops. This causes the core to cool and shrink. The very process of shrinking increases the temperature in the core again and releases a burst of energy. Just outside the core, in a shell surrounding it, the temperature becomes high enough for nuclear fusion of hydrogen to helium to take place. As the shell continues to fuse hydrogen into helium it dumps the helium ash into the now very dense and rapidly heating core. If the star is massive enough, the core eventually becomes hot enough to start fusing helium into beryllium, carbon and heavier elements.
In any case, the structure of the star changes A central helium core forms which is very dense and very hot surrounded by a shell of hydrogen fusing into helium. The luminosity (energy radiated per second) of the star becomes greater than it was on the main sequence. The outer layers of the star expand a great deal, and actually cool down, so the star appears redder. The radiation energy per unit surface area per second becomes less, but because the outer layers of the star are much bigger, the surface area also increases a lot so that the total radiation energy per second is greater. The star has become a red giant.
The position of the star on the H-R diagram moves off the main sequence band. It moves to the right (redder) and somewhat upwards (more luminous). As the star continues to evolve, it moves further to the right and upwards and continues to do so, unless and until helium starts to burn in the core - but that's another story.
Let us leave individual stars, their evolution and their position on the H-R diagram for the moment and consider a type of star cluster called a globular cluster.
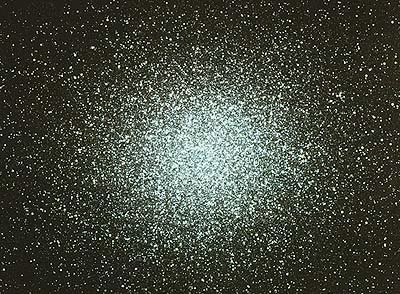
Globular clusters

The Milky Way galaxy where we live is a spiral galaxy. The stars of which there are estimated to be about one hundred billion are arranged in flat spiral. The Milky Way constellation that we see from earth, is basically the galaxy seen edge on. Our solar system is about 4/5ths of the way from the centre in one of the arms. Almost all the stars in the galaxy lie in its plane. There are however clusters of stars, called globular clusters, that can lie outside the plane of the galaxy. There are some 200 known globular clusters associated with the Milky Way galaxy, the closest of which is NGC6397 about 2.3 kiloparsecs away.
These clusters are more or less spherical clouds of typically a million stars. The clusters have very high number and mass density compared with the main galaxy (the stars in them are very closely packed, relatively speaking, of course). They are therefore tightly bound gravitationally. They generally lie outside the plane of the galaxy and roughly within a sphere centred on the galactic centre and with a diameter of about 100,000 light years. They do not follow the disc rotation of the galaxy, but instead follow highly eccentric elliptical paths that lie far outside the galaxy. They are believed to belong to a population of stars that were formed at the same time in a tightly bound gravitational state. Thus they are of similar ages and they are generally very old. We think that they are old, because spectroscopic studies show that they have very low concentrations of higher atomic mass elements. The heavier elements are more common in stars that formed from the debris of earlier, now dead stars. This is because the heavy elements are created in the dying throes of a star's giant phase. Very old stars that formed early in the life of the universe are formed primarily from hydrogen and helium, the primordial elements, and they do not contain the heavier elements as more recently formed stars do.
Globular clusters are interesting because star formation has long stopped in them. Formation is going on elsewhere in the galaxy, but not in globular clusters. The fact that the stars in globular clusters are all old leads to a very interesting property. The main sequence band on the HR diagram is very short and the red giant arm is very well defined. Let's focus on that now.
Main sequence turn-off and Age of the cluster
If we plot the stars in a globular cluster on the H-R diagram, we see something like Figure 2. Compare this with an H-R diagram for a general collection of stars in the galaxy Figure 1. You will see that the upper part of the main sequence is missing in Figure 2 and the red giant and horizontal branch of stars that have run out of hydrogen fuel in the core and come off the main sequence is well defined. What's going on here? Why are there no stars in the cluster still on the main sequence more luminous than the sun? Well, let us remember that there is a strong relationship between the luminosity, mass and longevity of a star. The more massive a star is, the more luminous it is and the shorter its life. So what we are seeing is evidence that in a globular cluster all stars above a certain mass have exhausted the hydrogen fuel in their cores and come off the main sequence. In fact, in most globular clusters all stars above 0.9 solar masses do not lie on the main sequence but on the red giant branch, the horizontal branch or have become white dwarfs, neutron stars or black holes..
|
Fig 2: Typical Globular Cluster H-R diagram |
||||||
In globular clusters, all stars greater than 0.9 solar masses have therefore exhausted the hydrogen fuel in their core and have become red giants or stars in an even later stage of life like horizontal branch stars, neutron stars or white dwarfs. Now here is the key point - the time it takes for a star of a given mass to exhaust its hydrogen fuel is well known from modeling of stellar processes as described above. The modeling of the sun indicates that its lifetime is about 10 billion years. It is currently 4.5 billion years old, so it will last for another 5.5 billion years before becoming a red giant. But in globular clusters, there are no stars the same mass as the sun still remaining on the main sequence. They have all come off the main sequence and are in later stages of stellar evolution. This means that globular clusters are at least 10 billion years old.
In fact there are no stars above 0.9 solar masses in many globular clusters. There is some uncertainty about the exact turnoff point on real H-R diagrams for globular clusters (arising, in particular, from uncertainty in measuring the stellar luminosities) that introduces some variation in the calculated minimum age of the clusters. The measured minimum age at the bottom of the error band is 11 billion years. This means that globular clusters are at least 11 billion years old. They must be this old for all the stars above 0.9 solar masses to have run their main sequence life. Since globular clusters are at least 11 billion years old, so must the universe be.
And, of course any red giant of around a solar mass anywhere in the universe puts a lower age on the universe of 10 billion years as that is the length of time a solar mass star takes to reach red giant stage and such stars are, indeed, known.
Conclusion
The main-sequence turn-off in globular clusters at around 0.9 solar masses puts a lower bound on the age of the universe of 11 billion years. The existence of red giants of the order of a solar mass puts a similar lower bound on the age of the universe.. All of this is consistent with the latest estimate of the age of the universe derived from measurements of the anisotropies in the Cosmic Microwave Background of 13.7 billion years. The best fit from globular cluster data is a remarkably close 13.4 billion years.
1. Krauss and Chaboyer, Age Estimates of Globular Clusters in the Milky Way: Constraints on Cosmology, Science 299, 65 - 69 (2003)
2.Chaboyer et al, A Lower Limit on the Age of the Universe, Science 271, 957 (1996)
3. Watson, The Universe shows its Age, Science 279, 981 - 983, (1998)
4. Lineweaver, A Younger Age for the Universe, Science 284, 1503 - 1507 (1999)
5. Phelps, Berkeley 17, The Oldest Open Cluster?, ApJ 483, 826 (1997)
6. Reid, Younger and Brighter - New Distances to Globular Clusters Based on HIPPARCOS Parallax Measurements of Local Subdwarfs, Astron J 114, 161 (1997)
7. Salaris and Weiss, Chronology of the halo globular cluster system formation, Astron Astrophys 327, 107 (1997)
8. Jimenez, Towards an Accurate Determination of the Age of the Universe, available here:
http://xxx.lanl.gov/abs/astro-ph/9810311
9. Pont et al, Hipparcos subdwarfs and globular cluster ages: the distance and age of M 92, Astron Astrophys 329, 87, 1998
10. An excellent simulation of the H-R diagram main sequence turnoff can be found here:
http://www.astro.ubc.ca/~scharein/a311/Sim/hr/HRdiagram.html
Copyright © evolutionpages.com 2003 - 2004 - all rights reserved